ANALYTICS
User-friendly dashboards make it easy to track performance, so you can quickly identify any gaps, optimize workflows, and improve patient outcomes.
See key dosing metrics, with as much or as little detail as you’d like. Filter your data view and download a snapshot of the dashboard at any time. Get presentation-ready, in seconds.


Compare trough vs. AUC outcomes
See the correlation between trough and AUC24 outcomes, a powerful visualization of the benefits of AUC dosing.
Easily assess patient risk
Understand patient risk indicators, like AKI, to help prevent adverse patient outcomes.
Track time to therapeutic targets
Evaluate time to reach target AUC to uncover institutional trends. Filter by drug model or time, it’s up to you.
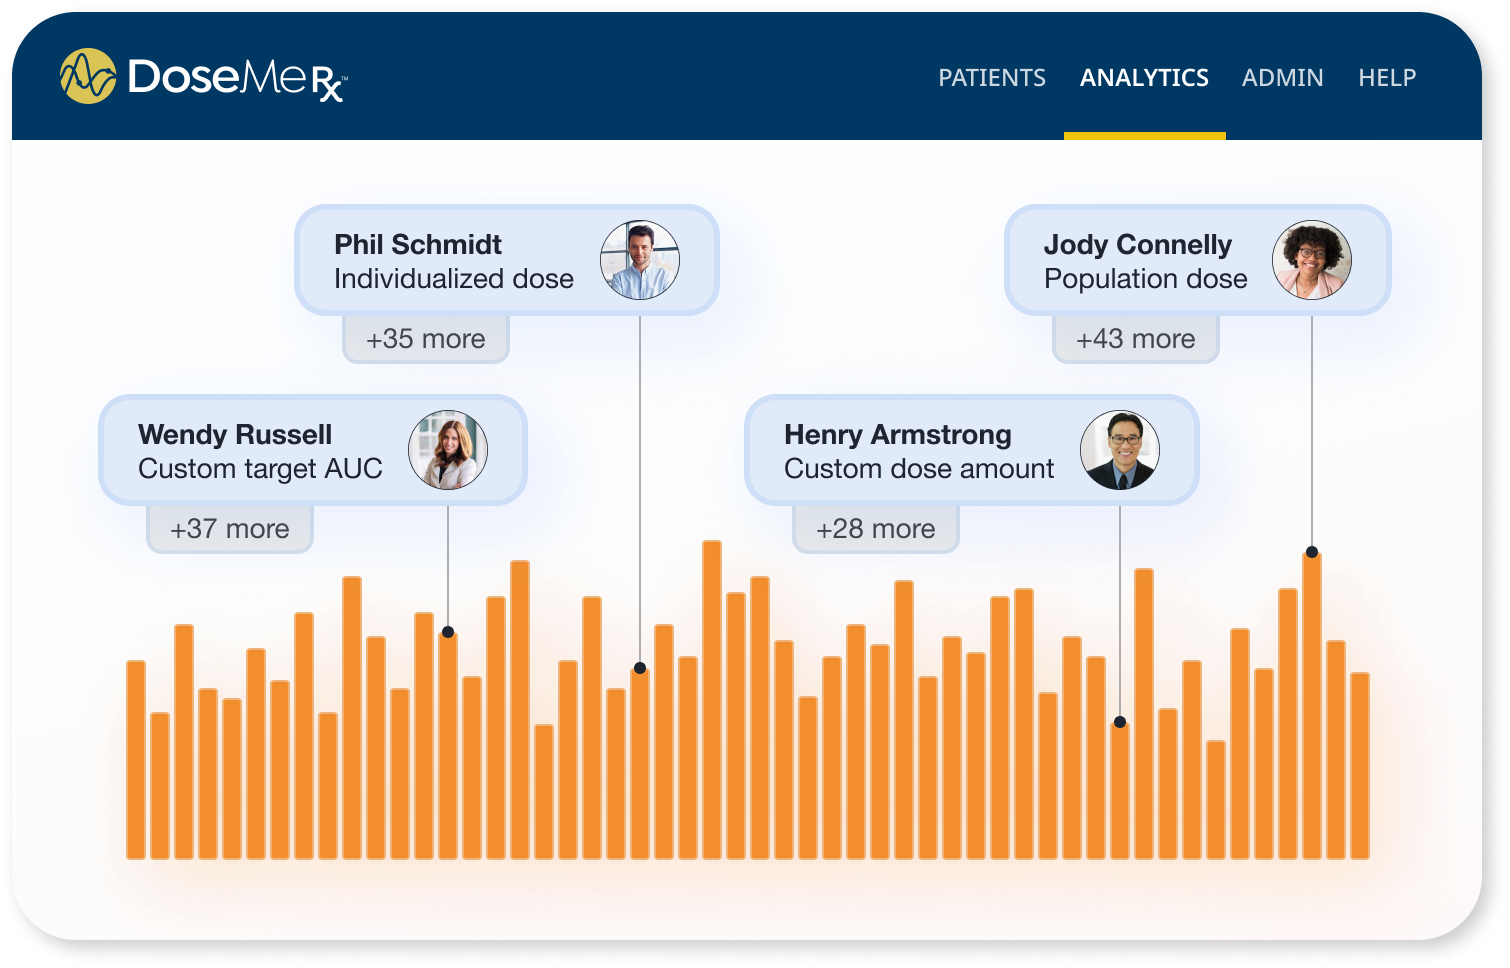
Monitor daily dosages
Track the average dose administered alongside the average individual dose amount to monitor your team’s change in dosing practices.


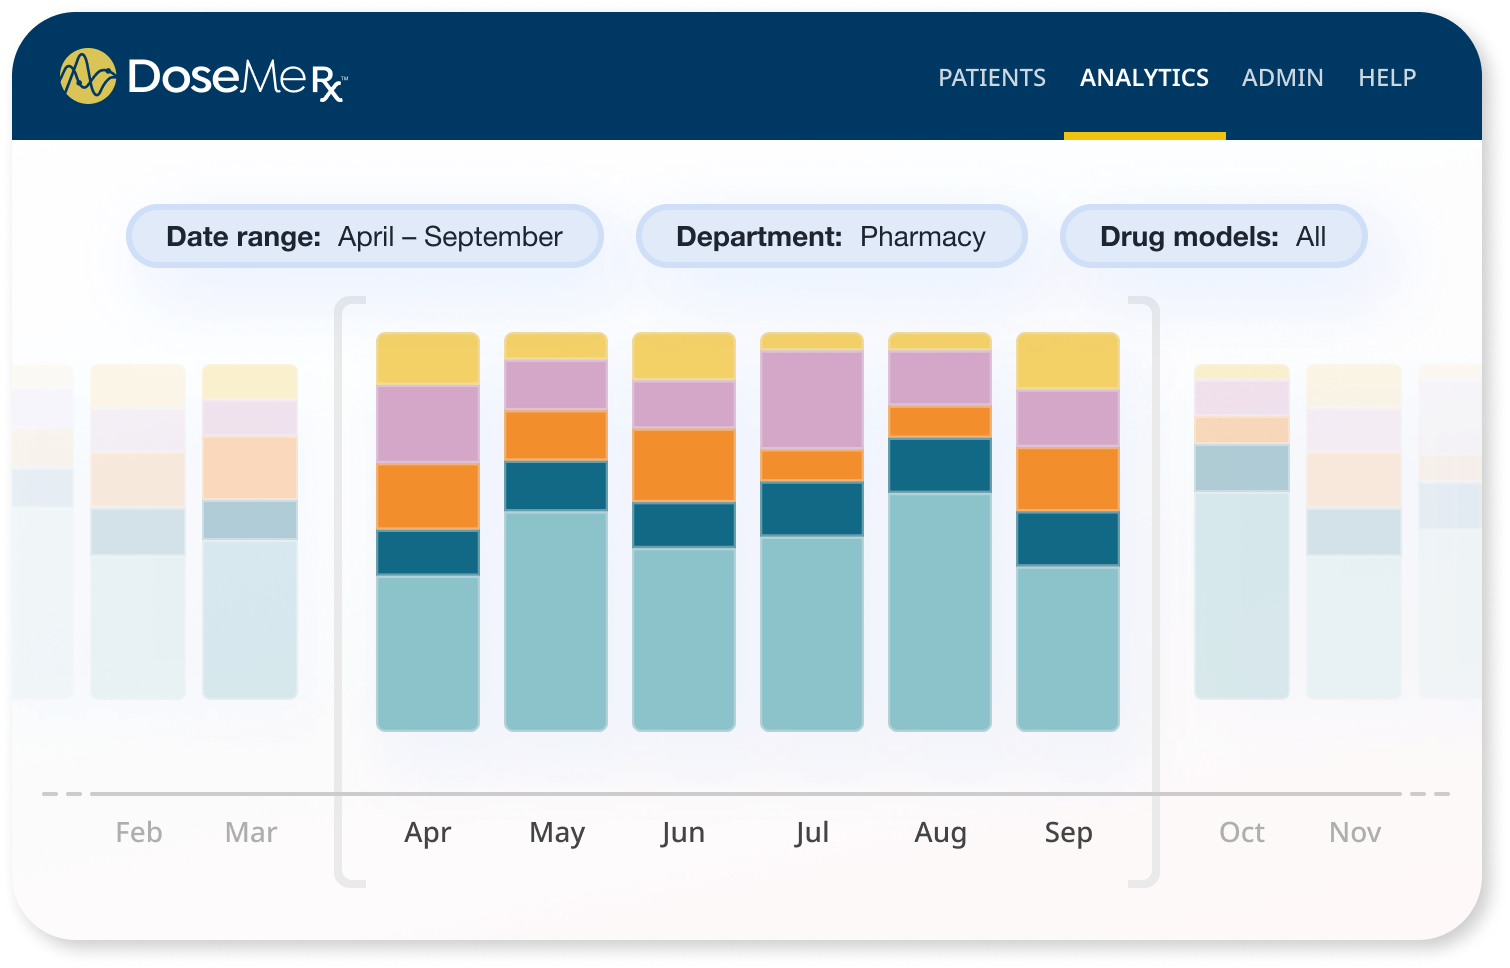
Get an understanding of your
team’s drug model usage
Gain insight into whether or not usage aligns with expectations and actual patient demographics.
Monitor protocol compliance
Track the amount of dosing reports generated to help monitor adherence to your protocol, and identify any needs for revision.
Discover ways to optimize workflow
Understand when your team uses DoseMeRx the most to help improve efficiencies.


Real-time data feed
Available directly in DoseMeRx
(no need for third-party programs!)
Easy to use dashboards
Presentation-ready interactive visualizations
Want to learn more about how DoseMe Analytics can help you improve patient outcomes, create operational efficiencies, and power your institution with data-driven insights? Get in touch today.
See how easy DoseMeRx is to operate and integrate into your workday.
Request a demo below. You can also phone us on +1 (832) 358-3308 or email hello@dosemehealth.com.
"*" indicates required fields
HIPAA Privacy Statement | Privacy policy | DoseMe & the GDPR | Copyright © 2012 - 2026 DoseMe Pty Ltd. All Rights Reserved.
DoseMe® is a registered trademark of DoseMe Pty Ltd. DoseMeRx℠ and DoseMe℞℠ are service marks of DoseMe LLC.